market_report
6.1 Market
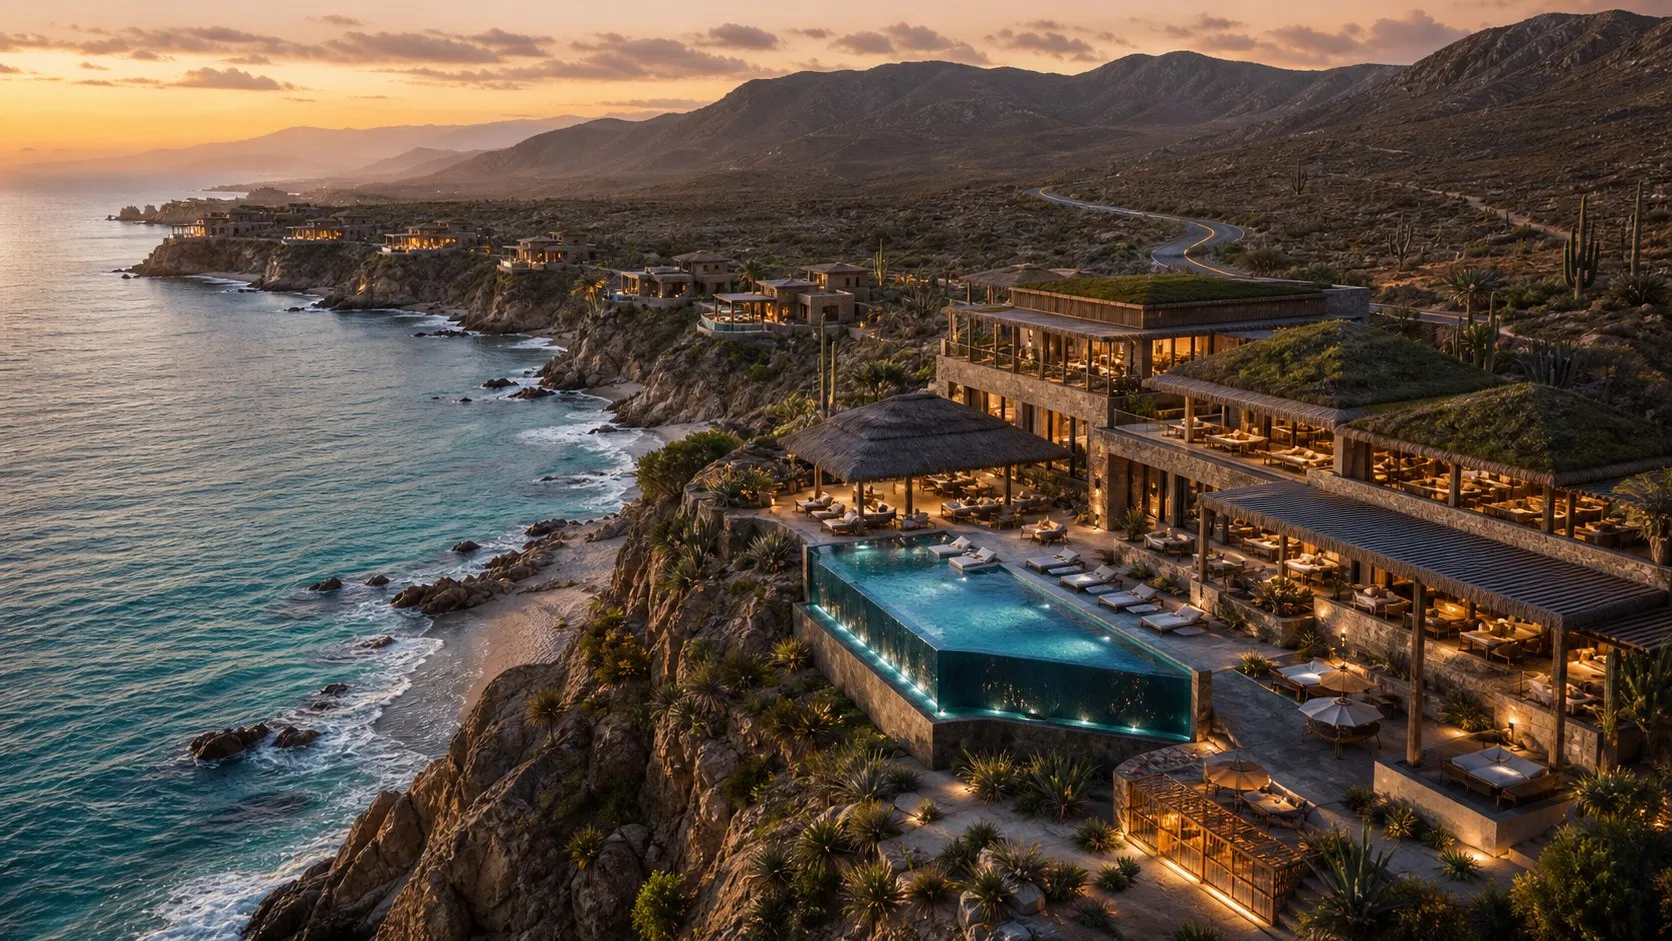
Slide 1 - Cover (LAVisions layout)layout: title_hero · 16:9

Solara Cove
Market & Demand
Why Baja, and why now.
MK 01 / 10
Market & demand
A deep, supply-constrained market for branded coastal resort real estate
$12.0BLos Cabos resort & residence market
Annual transaction value across the corridor, growing about 6% a year
San Jose del Cabo, Cabo San Lucas, the East Cape and the Pacific corridor
$3.2BBranded, operator-run segment
The reachable, operator-branded coastal pool, growing about 7% a year
Where Solara competes, faster than the market around it
$180MSolara Cove
An $85M stabilized resort plus $95M of forward-sold residences
90 keys at a 7.5% cap and 40 villas at about $2.375M each
MK 02 / 10
Why now
Why Baja California Sur, and why now
01
US buyers are next door
The Los Cabos corridor draws US second-home buyers on direct flights. Proximity and easy access drive steady, dollar-based demand.
02
Branded residences absorb fast
Operator-branded villas in the corridor sell ahead of new supply and command a premium over unbranded coastal stock.
03
Coastal supply is constrained
Entitled beachfront land is scarce and slow to permit. Institutional buyers compete for stabilized, operator-branded resort assets that rarely come to market.

MK 03 / 10
Deal economics
Two income streams: stabilized resort NOI and residence sell-out
Main income
Stabilized resort NOI per year
90 keys at $620 ADR and 60% occupancy produce about $19.3M revenue and a 36% GOP margin. After the operator fee, stabilized NOI is $6.37M, worth $85M at a 7.5% cap.
Development margin
Development margin
40 villas forward-sold at about $2.375M each generate $95M of sales against build cost, the core of the $52M development profit.
MK 04 / 10
Annual corridor transaction value
About 6% compound annual growth in corridor transactions, 2025 to 2029
Corridor transaction analysis, 2026
Transaction activity by Los Cabos submarket
Annual resort and branded-residence transaction value, summed across the corridor's submarkets
Submarket by submarket across the Los Cabos corridor
unit a = annual resort and branded-residence transactions; unit b = deals per asset per year; unit c = average transaction value in the submarket
$12.0B
Cabo San Lucas and the Corridor
Annual transactions
2,000
Deals per asset
1
Average value
$3,000,000
$6.0B
San Jose del Cabo and the East Cape
Annual transactions
1,750
Deals per asset
1
Average value
$2,000,000
$3.5B
The Pacific corridor
Annual transactions
1,250
Deals per asset
1
Average value
$2,000,000
$2.5B
MK 05 / 10
Depth of buyer demand
$3.2B
Branded, in the corridor, active buyers, transactable assets: about $3.2B of reachable demand
Four screens on demand
Segment: branded, operator-run resort and residences only - 40%
concentrates on operator-branded product and excludes the unbranded coastal tail
Geography: the Los Cabos corridor Solara can reach - 85%
excludes coastal volume outside the San Jose del Cabo to Cabo San Lucas corridor
Buyers: US and international purchasers active in the market - 90%
excludes the small share of buyers who transact only through private off-market channels
Assets: stabilized product open to institutional sale, not held off-market - 87%
excludes founder-held and legacy assets that never reach an open sale process
MK 06 / 10
Solara's offering
Solara's position today
$180M
| Year | Corridor market | Reachable buyer pool | Solara Cove | Total |
|---|---|---|---|---|
| Y1 | y1 unit a count | y1 unit b rate | y1 unit c value | y1 total |
| Y2 | y2 unit a count | y2 unit b rate | y2 unit c value | y2 total |
| Y3 | y3 unit a count | y3 unit b rate | y3 unit c value | y3 total |
| Y4 | y4 unit a count | y4 unit b rate | y4 unit c value | y4 total |
| Y5 | y5 unit a count | y5 unit b rate | y5 unit c value | y5 total |
Active users
MK 07 / 10
Industry Growth and CAGRAbout 6% compound annual growth through 2029
Tourism and real-estate market sources, 2025 to 2026
Los Cabos resort and branded-residence transactions about $12B, +6% year over year 2025
Branded, operator-run coastal segment growing about 7% a year
US visitor arrivals to Los Cabos up about 8% year over year
Baja California Sur branded-residence sales about $2B a year, roughly 7% growth through 2031
MK 08 / 10
Market Challenges
Four real risks, each with a clear mitigant for Solara
Construction cost and programme risk
A 60-month build carries cost and timing risk, and a $10M overrun moves project profit
A 5% contingency, fixed-price contracts and a staged programme absorb the swing
Residence sales absorption
Villa sell-out depends on steady buyer demand across the build period
Forward-sales and about $19M of deposits lock in buyers before completion
New competing supply
A new branded resort or residence scheme could enter the corridor during lease-up
Constrained coastal land and a signed operator hold Solara's position first
Resort lease-up and exit timing
Stabilized NOI depends on the resort ramping to 60% occupancy under the operator
The operator's brand and distribution drive ADR and occupancy from opening
MK 09 / 10
Key Takeaway
The Los Cabos corridor: scarce coastal supply, close US buyers, branded demand

Total resort & residence market
$12.0B
Addressable buyer pool
$3.2B
Solara's offering
$180M
Compound Annual Growth Rate
6.0%

MK 10 / 10