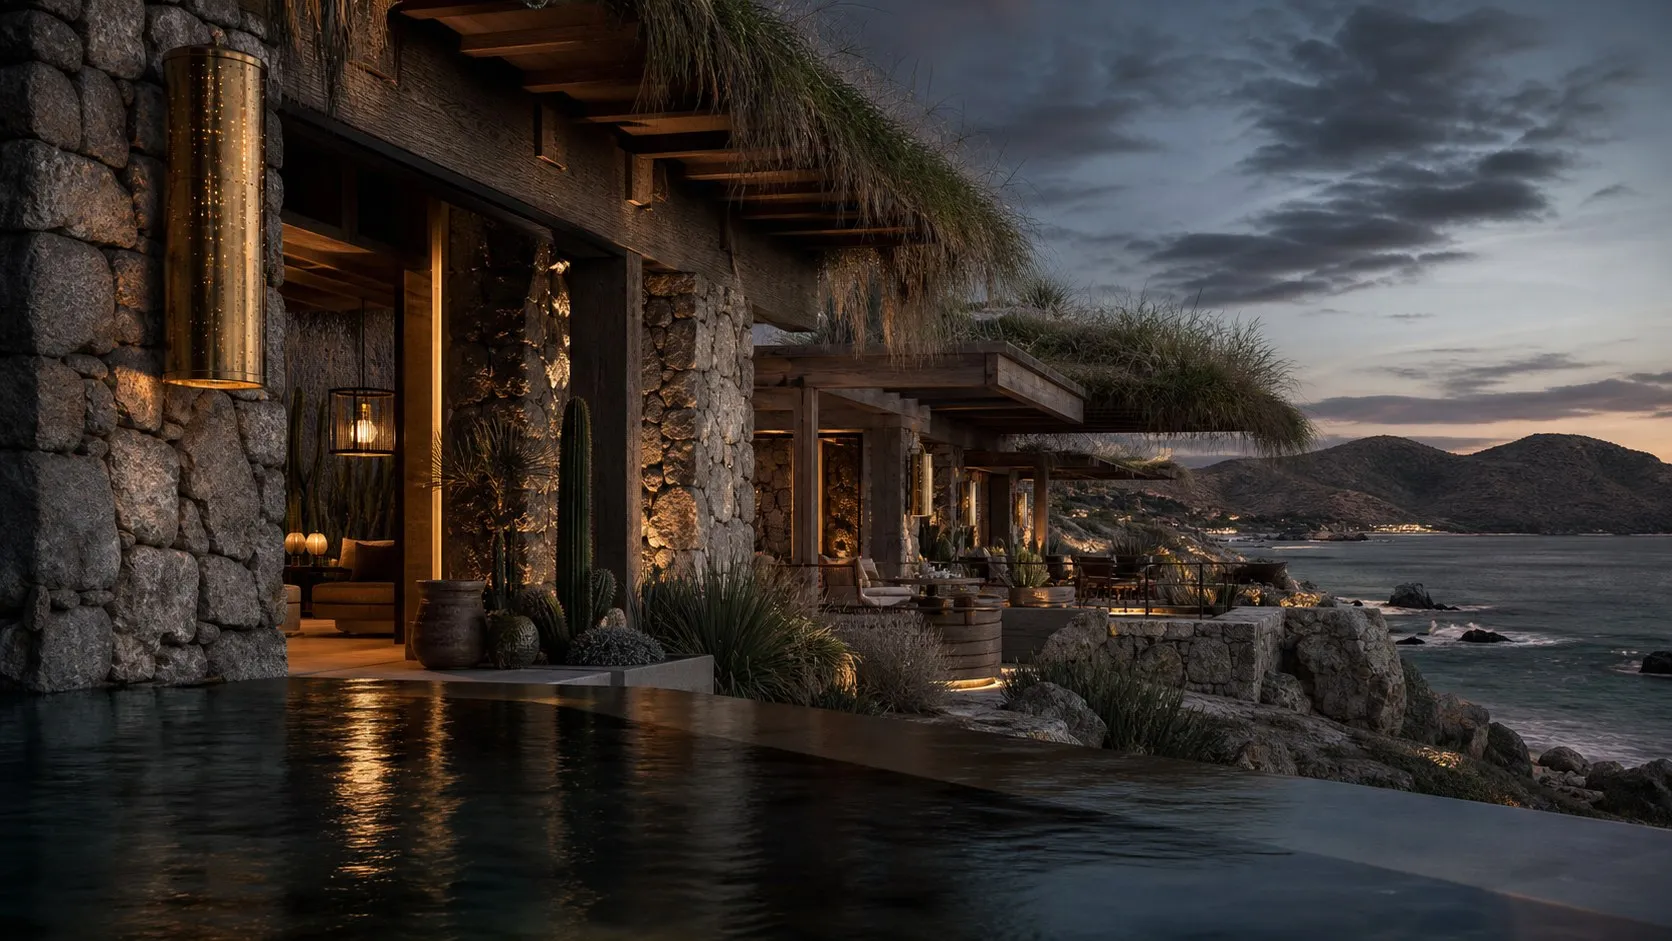
A $180M coastal asset offered at $52M of profit and a 21% blended return
$180M
Gross development value
Resort plus branded residences
$52M
Development profit
About 41% on cost
21%
Blended project IRR
Over a 60-month programme
2.0x
Equity multiple
On roughly $57.5M of equity
24-month forecast — P&L · cash · capital (S$ M)
Solara Cove pairs a stabilized 90-key resort with 40 forward-sold villas. The two components carry $180M of value against $128M of cost, which leaves $52M of profit and a 21% blended return over the programme.
Dashboard · 03
Two components, one deal: an $85M resort and $95M of residences
$85M
Resort value
90 keys at a 7.5% cap
$95M
Residence sell-out
40 branded villas, forward-sold
$180M
Combined GDV
Resort plus residences
130
Total units
90 keys and 40 villas
24-month use of funds — cash flow (S$ M)
Allocation of funds
The stabilized resort is offered to an institutional buyer at $85M. The 40 branded residences are forward-sold to private buyers at $95M. Together they make up the $180M gross development value.
Dashboard · 04
A 90-key resort stabilizing at $6.37M of net operating income
$6.37M
Stabilized NOI
After the operator fee
$620
Average daily rate
Operator-branded pricing
60%
Occupancy
At stabilization
$372
RevPAR
Rate times occupancy
5-year forecast — S$ M (annual)
At 60% occupancy and a $620 average daily rate the resort produces about $19.3M of revenue. A 36% gross operating margin, net of the operator fee, leaves $6.37M in net operating income.
Dashboard · 05
$6.37M of income at a 7.5% cap sets the resort at $85M
$85M
Resort value
NOI divided by a 7.5% cap
7.5%
Exit cap rate
Institutional benchmark
$6.37M
Stabilized NOI
The income being capitalized
$944k
Value per key
$85M across 90 keys
Monthly clients — 24 months
Registered base — annual
The resort is valued by capitalizing stabilized income. $6.37M of NOI at a 7.5% exit cap rate gives an $85M sale price, or about $944,000 per key to the institutional buyer.
Dashboard · 06
40 branded villas at $2.375M each, forward-sold to private buyers
40
Branded villas
Beachfront and hillside
$2.375M
Average villa price
Operator-branded product
$95M
Residence sell-out
Gross sales value
$19M
Forward deposits
About 20% taken up front
Revenue by category — 24 months
Revenue by category — annual
The 40 villas sell at an average of $2.375M for $95M in gross sales. Buyers place deposits of roughly 20%, about $19M, which helps fund construction and takes risk out of the project.
Dashboard · 07
$180M of proceeds from villa sales and resort income
$95M
Villa sales
40 forward-sold residences
$85M
Resort disposition
Stabilized asset sale
$19.3M
Annual resort revenue
At stabilization
$180M
Total proceeds
Residences plus resort
Per-client economics — annual ($)
Proceeds come from two sources. Villa settlements return $95M as units complete, and the stabilized resort sells for $85M. Combined, the deal returns $180M against $128M of cost.
Dashboard · 08
$128M to build: land, construction, soft costs and finance
$128M
Total development cost
Land through completion
$22M
Land
Entitled coastal parcel
$83M
Construction
$44M resort, $39M villas
$23M
Soft costs and finance
Design, fees, contingency, debt
Cumulative gross profit — 24m
Gross profit & margin — annual
Development runs to $128M. Land is $22M and construction is $83M, split between the resort and the villas. The balance of $23M covers design, fees, a 5% contingency and finance.
Dashboard · 09
A $70M senior loan and $57.5M of equity fund the build
$70M
Senior loan
About 55% of total cost
55%
Loan to cost
39% loan to GDV
$57.5M
Equity
Sponsor and co-investors
$19M
Forward deposits
Fund construction alongside debt
COGS components — 24 months
COGS components — annual
The build is funded by a senior loan of about $70M at 55% loan to cost and 39% loan to GDV, roughly $57.5M of equity, and $19M of villa deposits. The loan sits behind a first charge and is repaid from villa settlements and the resort disposition.
Dashboard · 10
A 21% blended IRR and a 2.0x equity multiple
21%
Blended project IRR
Over 60 months
2.0x
Equity multiple
On invested equity
$52M
Development profit
GDV less total cost
41%
Profit on cost
About 29% on GDV
Marketing spend — 24 months
Marketing spend — annual
The project returns a 21% blended IRR and a 2.0x equity multiple over its 60-month life. Profit of $52M sits at about 41% on cost and 29% on gross development value.
Dashboard · 11
A 60-month path from land close to resort disposition
60 mo
Total programme
Land through exit
36 mo
Construction
Resort and villas
Mo 30-42
Villa settlements
Forward-sale balances paid
Mo 54-60
Resort sale
Stabilized disposition
Spend split
Direct vs indirect — annual
The programme runs 60 months. Construction takes about 36 months, villa settlements land between months 30 and 42, the resort ramps to stabilization, and disposition closes by month 60.
Dashboard · 12
Villa reservations and deposits de-risk the build before completion
40
Villas for sale
Forward-sold to private buyers
$19M
Deposits taken
About 20% up front
$95M
Contracted sell-out
Paid at settlement
$2.375M
Average price
Per branded villa
Overheads — 24 months
Overheads — annual
Villas are reserved off plan with deposits of about 20%. Roughly $19M is collected up front against a $95M contracted sell-out, so demand is proven well before the resort opens.
Dashboard · 13
Value holds across a range of cap rates and operating outcomes
$79M-$91M
Resort value range
7.0% to 8.0% exit cap
0.5%
Cap rate tested
Half a point off the 7.5% base
55-65%
Occupancy tested
Around the 60% base
$52M
Base-case profit
Holds across the range
Product dev — 24 months
Product dev — annual
Resort value moves with the exit cap. At 7.0% to 8.0% the resort is worth roughly $79M to $91M. Occupancy in a 55% to 65% band and modest rate changes leave the $52M profit intact.
Dashboard · 14
Baja California Sur: proven demand for branded coastal assets
90 keys
Resort scale
Institutional-size asset
40 villas
Branded residences
Second-home buyer pool
$620
Achievable ADR
Los Cabos corridor rates
60%
Stabilized occupancy
In line with the market
Revenue / employee — annual
Headcount — annual
Salary split — annual
The site sits in the Los Cabos corridor, a leading US second-home market with direct flights and constrained coastal supply. Branded residences absorb well, and institutional buyers seek stabilized resort assets at this scale.